Premium
What 16 years of satellite images reveal about rising Rift Valley lakes
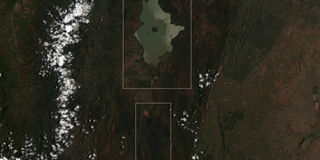
A satellite Image of Lake Baringo and Lake Bogoria.

Something has been happening to two of the Rift Valley's lakes, and it hasn't happened overnight. Lake Baringo and Lake Bogoria, both in Baringo County, have been growing steadily for more than a decade, and this time the evidence isn't just what people are seeing on the ground. It's coming from space.
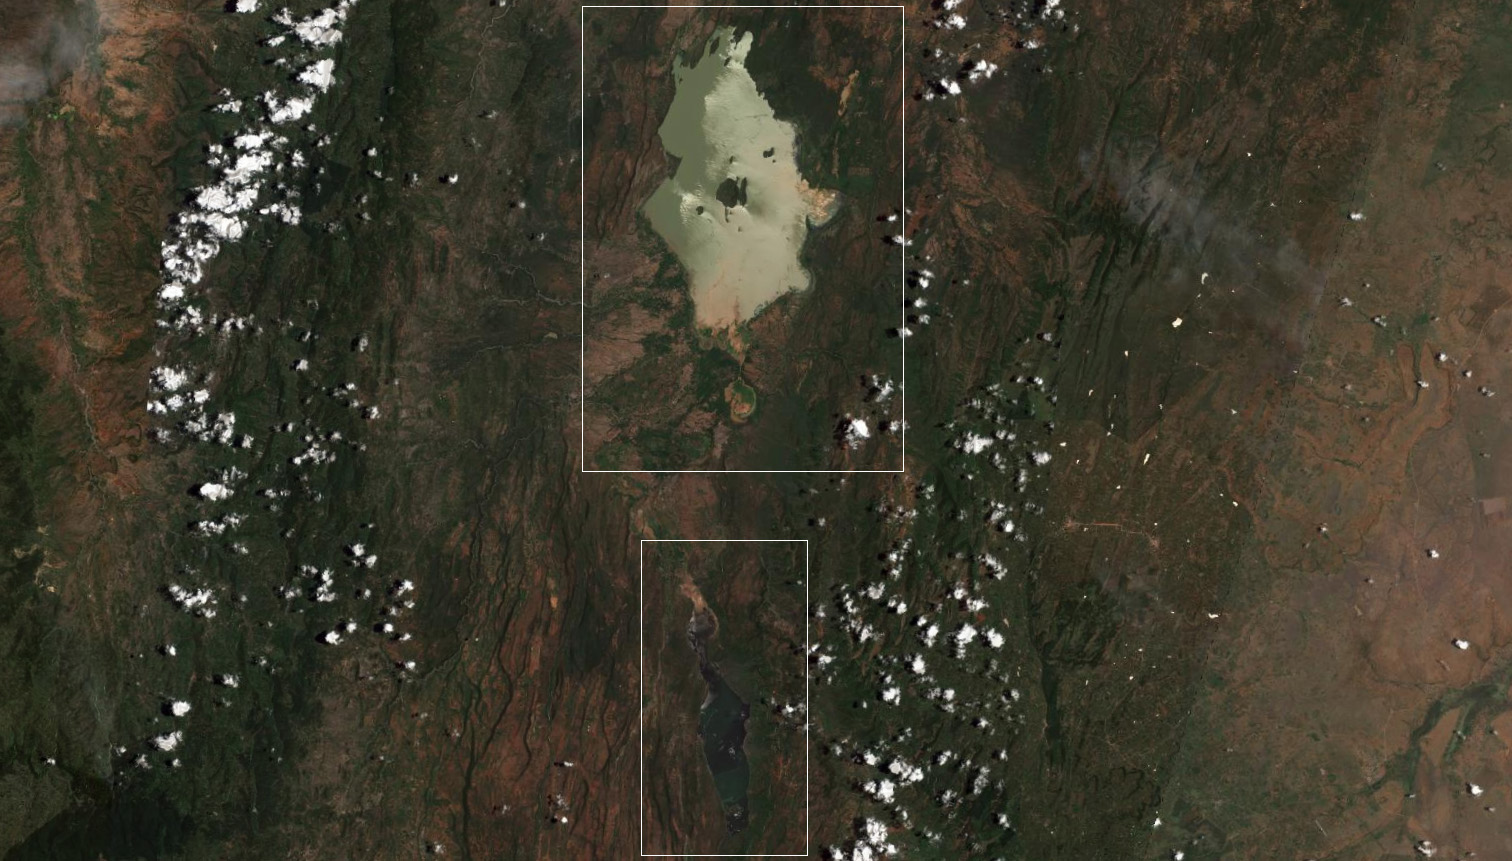
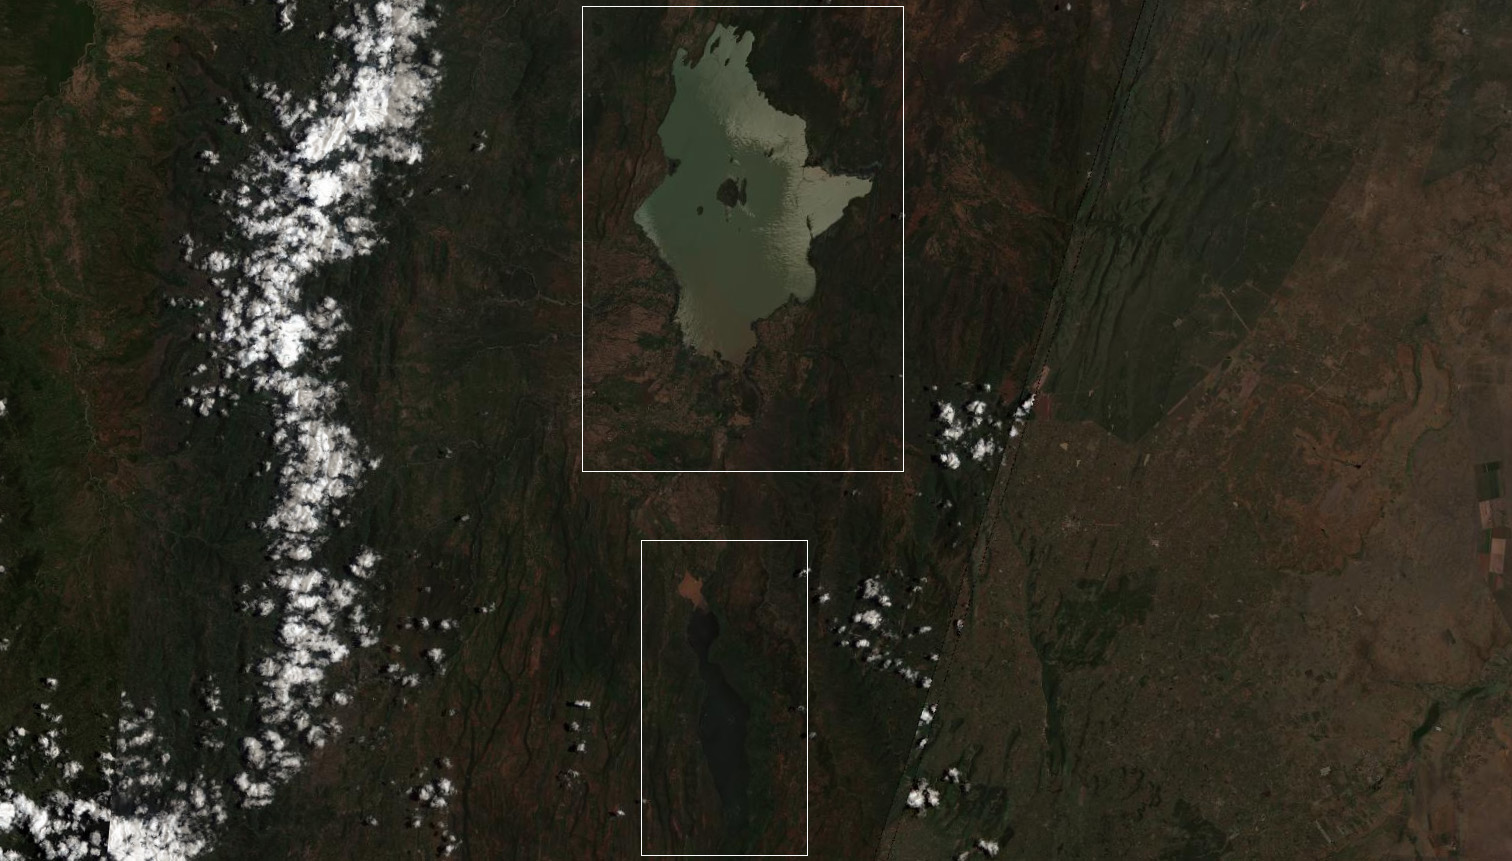
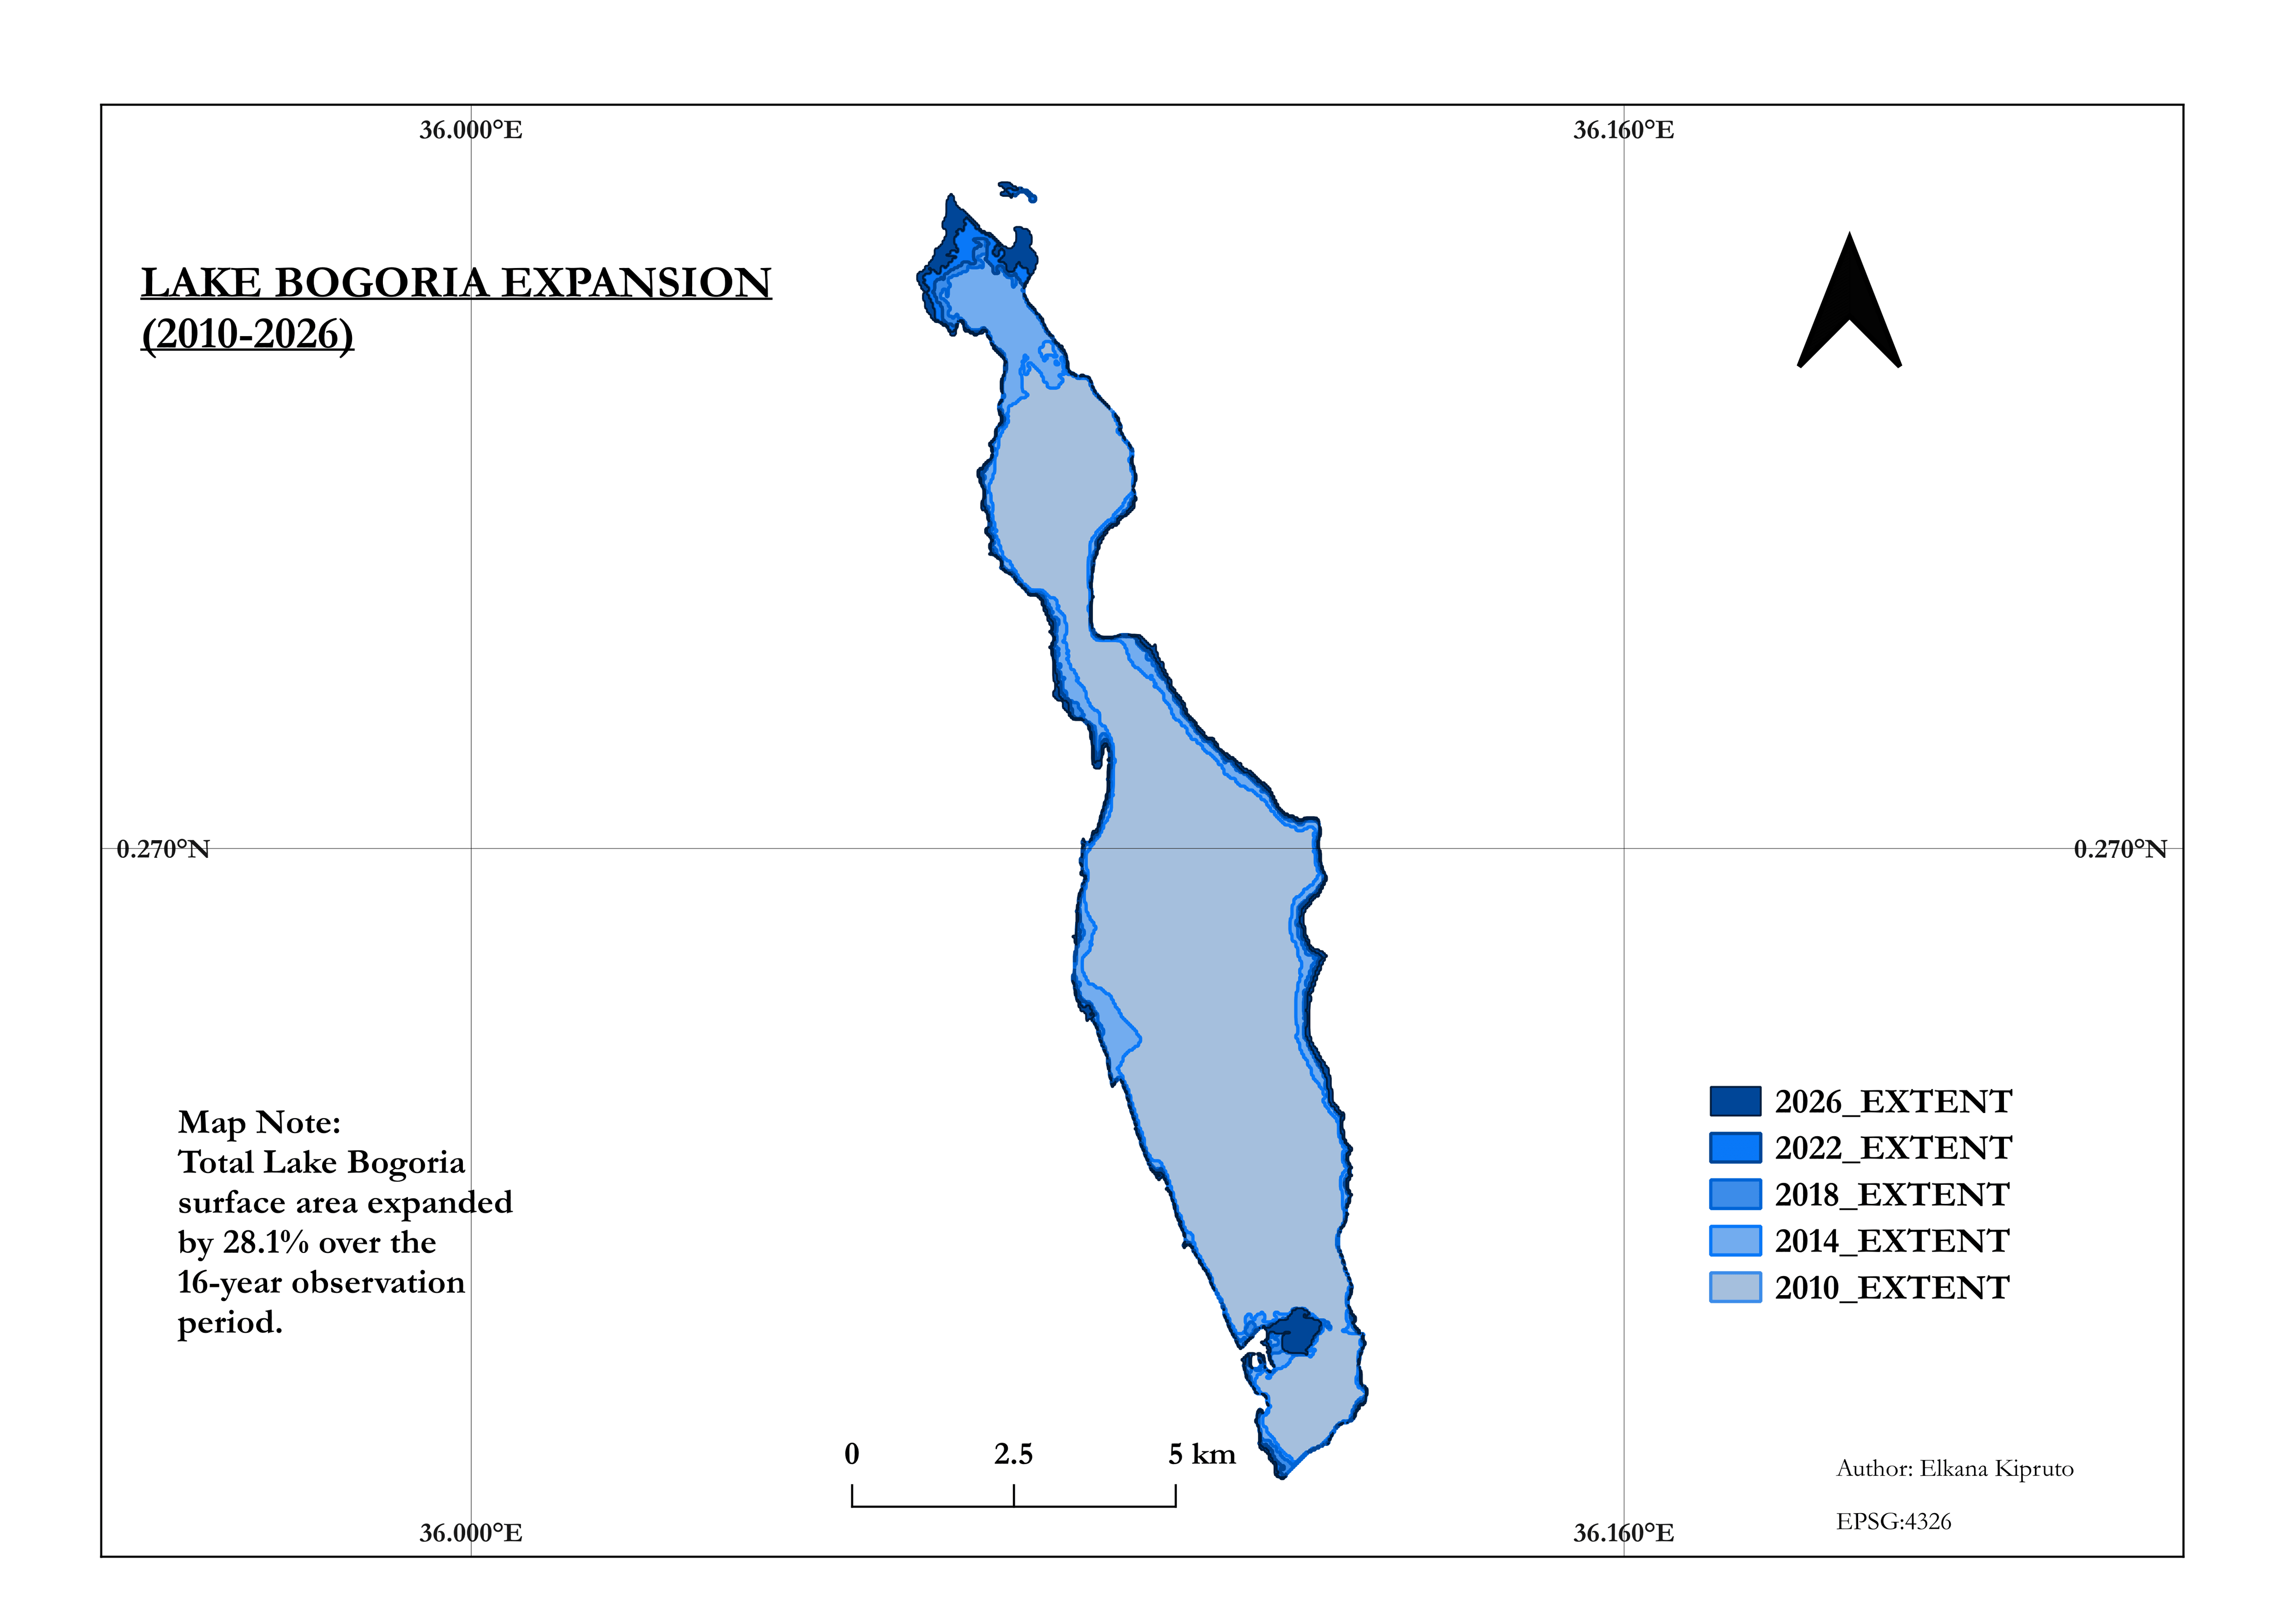
Elkana Kipruto is a geospatial data engineer and remote sensing specialist who works with satellites to make sense of things. His latest analysis pulled satellite images of both lakes at five points in time, spanning 2010 to 2026, and lined them up to see exactly how much water has spread since. The scale is striking.
Lake Baringo Growth
Lake Bogoria Growth
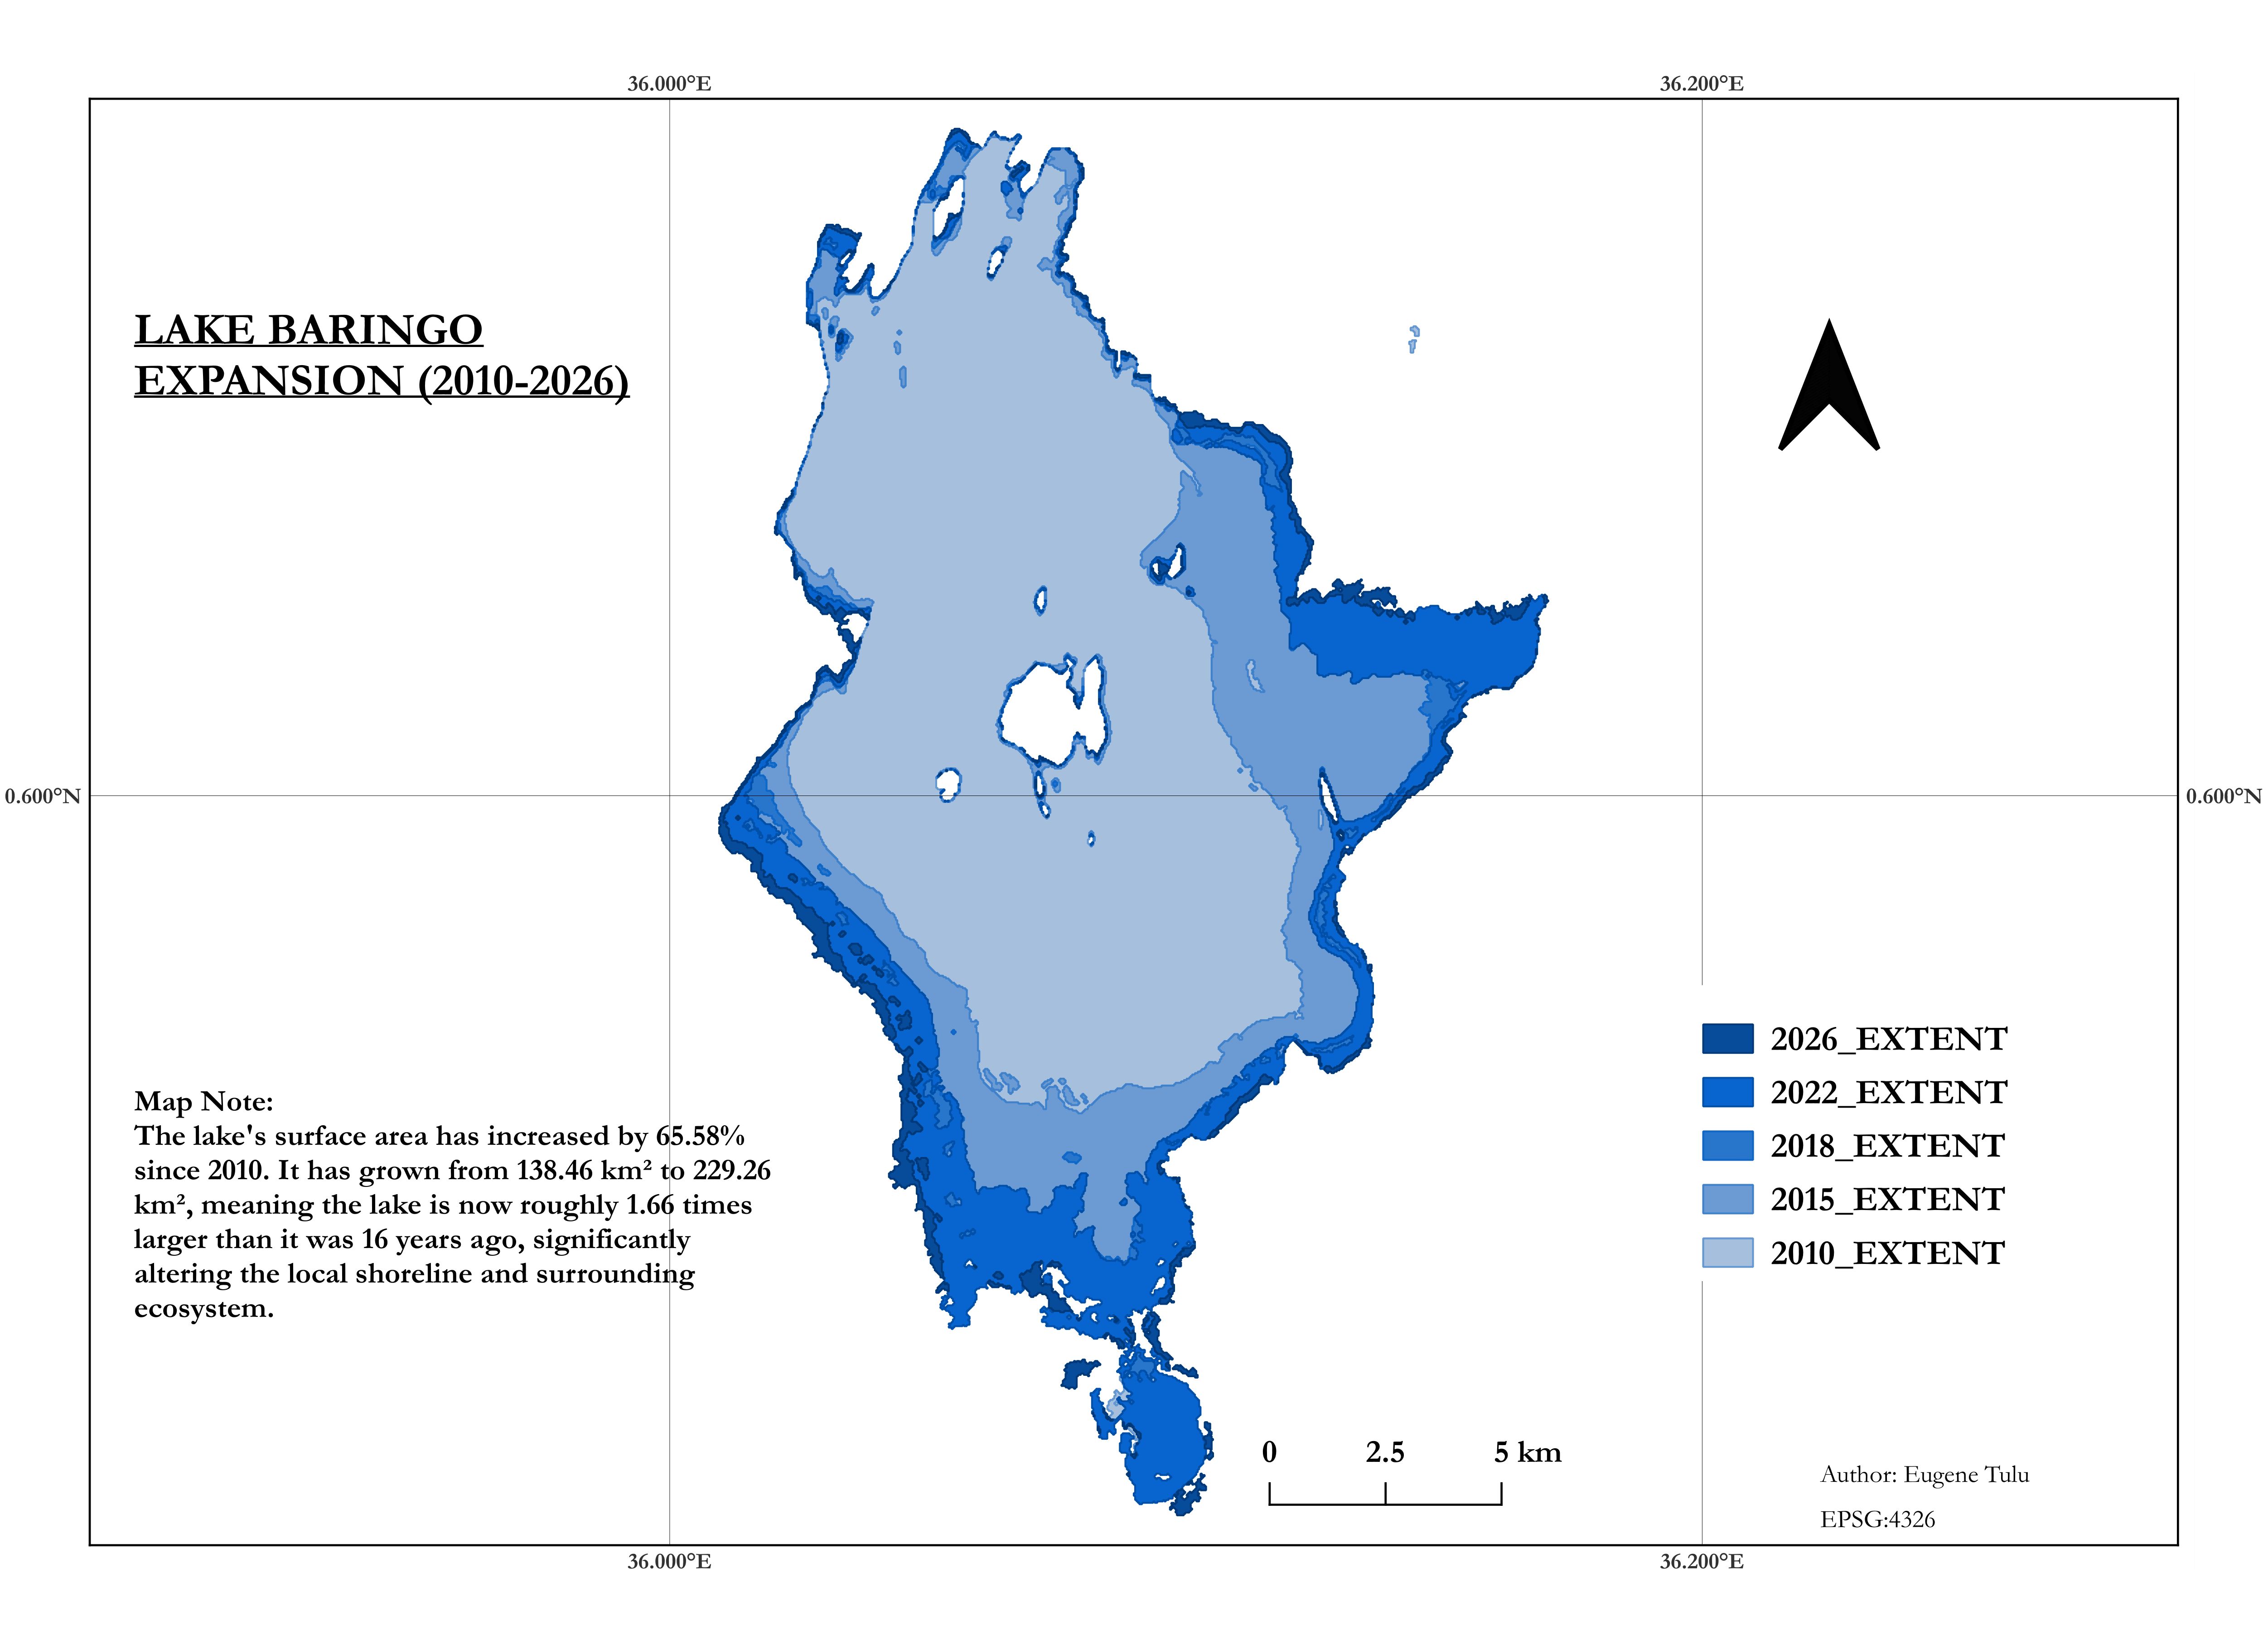
"Lake Baringo has grown from 138.5 square kilometres in 2010 to 229.3 square kilometres in 2026," his findings say. That's an extra 91 square kilometres of water, a 65.6 per cent increase, or as the report states, roughly three-quarters the size of Nairobi National Park added onto the lake in just 16 years.
Lake Bogoria's growth has been slower but no less real, from 33.7 square kilometres to 43.2 square kilometres, an increase of about 9.5 square kilometres, or 28.2 per cent, close to the size of Karura Forest.
Two very different lakes
Baringo and Bogoria are not the same kind of lake, and that shapes what their growth means. Baringo is freshwater. It's the kind of lake that supports fishing, livestock, and small-scale irrigation, which, according to the report, makes it "more directly usable" for daily life than Bogoria, and also means its expansion pushes into land people actively use.
Bogoria is different altogether: a closed, alkaline lake, known internationally for its geothermal hot springs and geysers, and officially designated a Ramsar wetland in 2001. It's a flamingo habitat first and an agricultural resource a distant second, so its growth carries more of a conservation and tourism story than a farming one.
How the researchers actually measured this
Kipruto's analysis shows water extent was classified at five separate points in time using a consistent index-based method applied uniformly across each image, specifically so the five measurements could be fairly compared against one another rather than being apples-to-oranges snapshots.
It wasn't a perfectly smooth process. For Lake Baringo, the 2014 satellite pass had to be scrapped entirely. According to the report, the Landsat scene available for that year "contained genuine sensor artifacts that would have compromised the water classification," so the nearest clean, reliable image was used instead, from 2015.
What the five snapshots show isn't a straight upward line, either. Lake Baringo's growth came in fits and starts, expanding quickly from 2010 to 2015, dipping slightly by 2018, then surging again through 2022 before easing off closer to 2026. Bogoria's growth, by contrast, has been steadier and more gradual across the same stretch of years, without those swings.
Strip away the different starting sizes of the two lakes and compare growth rates directly, and the gap is even clearer. "Baringo has expanded more than twice as fast as Bogoria over the same 16-year period," the report states.
Not just tracking the past, but the future too
The satellite work only tells you where the water has already been. To figure out where it might go next, Kipruto's analysis turned to elevation data, a Digital Elevation Model built from SRTM terrain data, mapped around both lakes' current shorelines.
The logic is simple: water flows downhill, so the lowest land bordering each lake is the land most likely to flood first if levels keep climbing. Around Baringo, the terrain analysis found exactly that kind of vulnerability, "flat, low-gradient basins with no natural topographic barriers to hold the water back," the report states. Bogoria shows a similar, if smaller, pattern to its north.
"The maps produced in this study should not be interpreted as flood forecasts," Kipruto explains in his findings. "They do not predict rainfall, future lake levels, or the timing of flooding. What they do instead, is answer a narrower, more useful question: if the lakes keep rising, where does the water go next?"
These vulnerable areas, the report states, "could have been identified using elevation data that has been publicly available for many years."
Where this leaves things
As the report states, this is "not a sudden disaster," but "the cumulative result of a slow, sustained trend" that satellite images have been recording the entire time.
Going forward, the report recommends three things: satellite monitoring of both lakes at least once a year to catch shoreline movement early, regular updates to the elevation-based risk maps as new shoreline data comes in, and, eventually, a broader catchment study to get at the underlying cause.